Cacti and Network Weathermap
14 April 2008
While improving the network at my house (an indeed, the network which supports this very web server), I started to explore the world of network monitoring and reporting. I had heard quite a bit about Cacti before, but never considered installing it. That was mostly due to the stories I had heard about how unholy difficult the damn thing is to get working properly. "Don't even go there" was my mindset. Until now, that is.
Cacti is a complete network graphing solution designed to harness the power of RRDTool's data storage and graphing functionality.
Brilliant. Network graphing is good, I want to see pretty charts and graphs about how my network is doing. So I gave it a go. Here's some of my ups-and-downs, and the end result.
First, I needed a linux machine to try this on. Cacti itself obviously wasn't enough of a challenge for me, I wanted to get it to work on an operating system with which I had very little experience. I chose Ubuntu Server 7.10 - I've worked with Ubuntu before, and I like the Aptitude package manager which would make this project somewhat easier for me.
So first of all, I installed the O/S. I'm using a Virtual Machine on my main VM host, which had some RAM to spare. I only have the machine 128MB, as I'm not going to be asking too much of it (hopefully). I didn't specify a LAMP install, even though that is exactly what would be required. I wanted to do all the fiddly stuff later on.
Once the O/S was on, I needed to install the required packages, and then Cacti itself. Cacti requires a web server, with PHP and GD (the image library), and a MySQL server. I followed this guide to get them all installed on this new machine, and then extracted and set up Cacti.
Worth noting here, is that when importing the cacti.sql file into the MySQL
database, I first created the database called cacti, then modified the
SQL file, adding use cacti to the beginning of the file - otherwise an error
stating "no database selected" would appear.
Once the database was setup, and Cacti was extracted - I pointed Firefox to the cacti server (I had a creative moment and called the Cacti server cacti). The setup process was web-based from here-on, and Cacti was installed in a matter of seconds.
So, now I added my hosts (after enabling the SNMP service on my Windows Servers, and configuring the community), and created some graphs. Just network traffic graphs at first. After a few polls, I was amazed to see the graphs populating perfectly. After following these instructions I made them look so much better (maybe not sexy, though!), and the result was something like this:
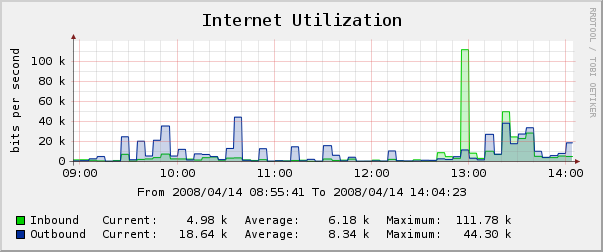
Wonderful. Pretty graphs showing me how much the internet connection is being used. 100k eh? Somehow I think paying for 20Mb isn't worth it!
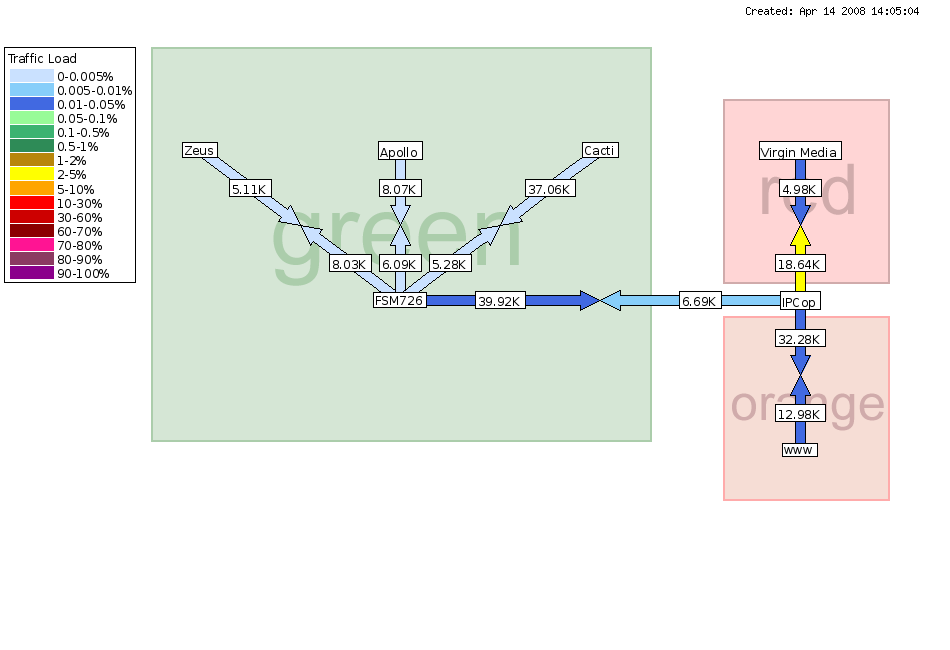
OK, so now I have lots of nice graphs, I wanted to get a Network Weathermap working - which is like a virtual network diagram, showing the traffic between each node on the map - as it reads the data from the same source as Cacti.
This was much easier than I thought - after adding the nodes and links into the config file, the values took on the colours of my scale as they should - and I had a lovely diagram of my network with automatically updating traffic information! Here's the end result.
And there we have it! Not at all as bad as I was expecting. I do hope this will be of help to anyone wanting to do something similar.